Recommended by:

Top 20 UK science resources,
The Tutor Website
Recommended by:

Rated:

2010
Listed on the science, engineering and technology section of

'providing you with access to the very best Web resources for education and research, evaluated and selected by a network of subject specialists.'
(Please note that intute closed in July 2011)
Appendices: a particularly poisonous final lollipop, sorry
APPENDIX iii: PHASE
EQUILBRIA
AND COLLIGATIVE PROPERTIES
NB This chapter has now been
updated to improve browser compatibility.
Please
use the 'send email' link at the top right hand corner of this page to
report any problems.
A3.1. INTRODUCTION
A3.1.1. Few, if any, examining boards these days require familiarity with these tiring topics. If anything's going to make your brain hurt, this will. Sorry. The theory is elaborate, and, arguably, at least well-placed after the concluding statements in appendix ii.
A3.2. ONE COMPONENT SYSTEMS
A3.2.2. If water is floated on the mercury in a barometer tube, it evaporates into the vacuum until the liquid water is in equilibrium with the water vapour. This exerts pressure and depresses the level of mercury in the barometer tube. The pressure is the vapour pressure of the water, and its value at the temperature of the experiment can be calculated from the depression of the mercury. At 25°C the level is depresed by 2.37cm, equivalent to a pressure of 3.17kPa.
If the temperature is reduced to -5°C, ice floats on the mercury. It may surprise you that the level of mercury is still depressed. True, it is depressed by only 3mm, but this shows that solids, too, have vapour pressures. The vapour pressure of ice at -5°C can be calculated from the depression of mercury as being 400Pa (in fact = 422Pa).
Another interesting (Note the attempt to keep you awake. 'Exciting' would be good. But even 'interesting' is pushing it.) point on the scale is 100°C where the mercury level is depressed by 760mm, equivalent to normal atmospheric pressure (101.3kPa). This is an indication that a liquid boils at the temperature where its vapour pressure equals atmospheric pressure. Note that although we think of 100°C as the boling point of water, the temperature will vary according to the prevailing pressure.
A3.2.3. Phase
diagrams: The results of numerous experiments like those in
section A3.2.2. can be plotted graphically. The resultant diagrams are
called phase diagrams, and the phase diagram for water is shown in FIG.
A3.1.
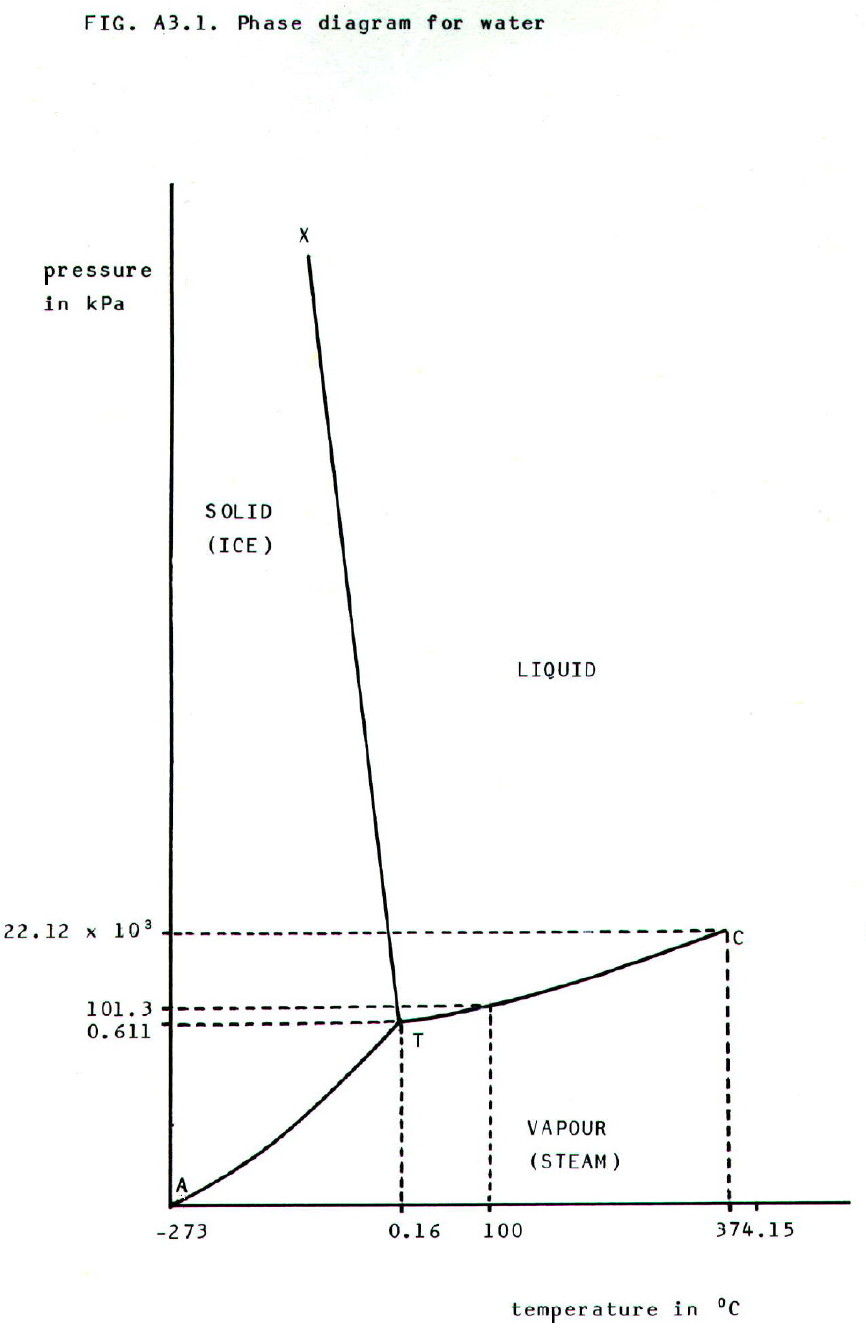
This is approximately the shape
of phase diagrams for most one-component systems.
• The graph is divided into three areas by three lines, AT, XT, and CT.
• Each area represents the conditions of temperature and pressure under which a particular phase (solid, liquid, or vapour) can exist.
• Each line represents the conditions of temperature and pressure under which two phases can exist in equilibrium:
AT = solid and vapour (sublimation curve)
XT = solid and liquid (fusion curve)
CT = liquid and vapour (vapourisation
curve)
• Point T represents the conditions of temperature and pressure under which all three phases exist in equilibrium. It is called the triple point, 0.16°C and 611Pa for ice/water/steam.
• Point C represents the conditions of temperature and pressure beyond which liquid and vapour are indistinguishable. It is known as the critical point.
A3.2.4. Kinetic description: When water is floated on the mercury in a barometer tube (section A3.2.1.) it is collisions of water molecules with the barometer walls and the liquid surface which are recorded as the vapour pressure at a particular temperature.
At the vapour pressure, water molecules are escaping the liquid surface at the same rate as they return. Thus, the vapour pressure at a particular temperature is the pressure of the vapour in equilibrium with the liquid at that temperature.
If the temperature is increased, the vigour of the motion of the particles in the liquid will increase. They will therefore escape the attractive forces of other particles in the liquid more frequently. When a new state of equilibrium is reached, the rate of particles leaving and returning to the liquid will be higher, and the number of particles in the vapour phase will be higher. Moreover, the speed of particles colliding with the barometer walls and the liquid surface will be higher, as will be the frequency of those collisions. Thus a higher equilibrium pressure (vapour pressure) will be recorded (chapter 5, especially section 5.4.).
The rate at which water molecules leave the surface of ice and enter the vapour phase is very low, and this is recorded as a very low vapour pressure (section A3.2.1.). Other phase changes are described in chapter 5, as are the energy considerations.
A3.3. TWO COMPONENT SYSTEMS (MIXTURES AND SOLUTIONS)
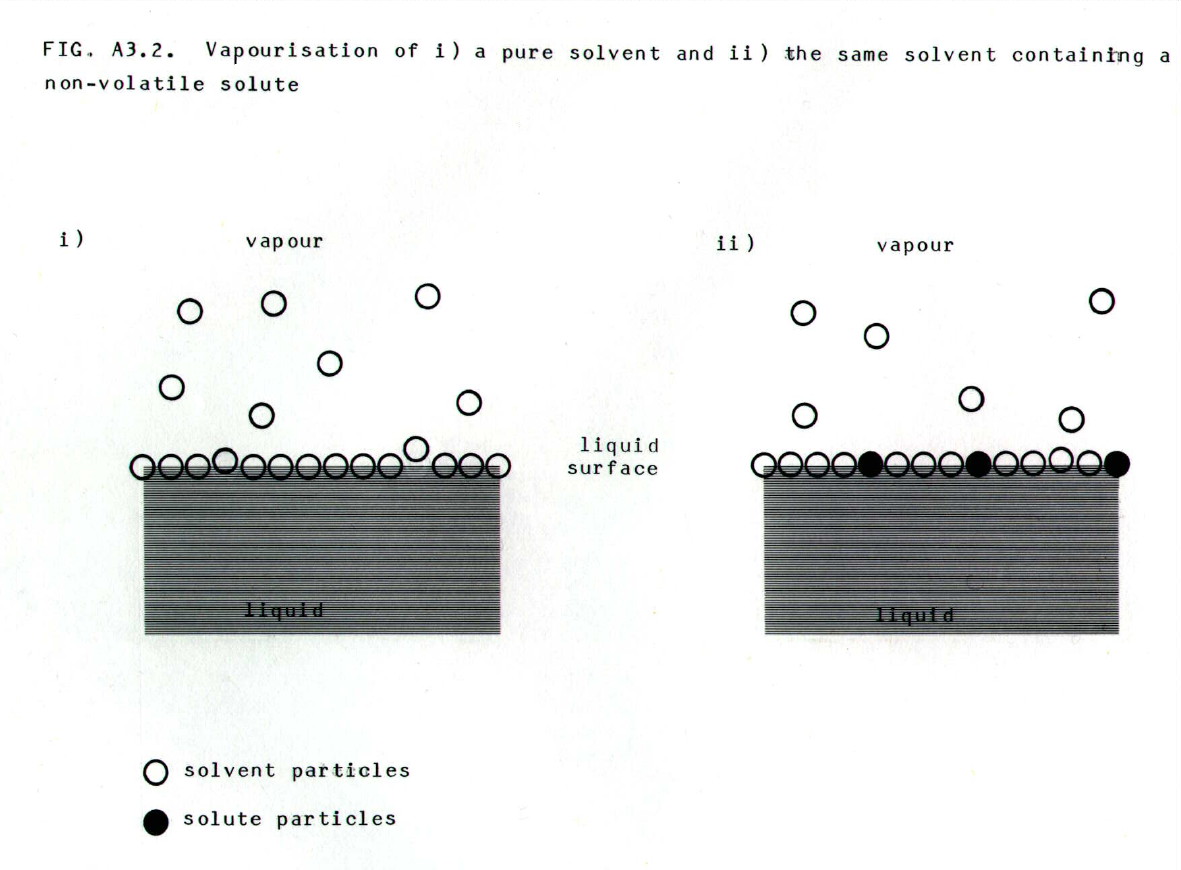
A3.3.1. Non-volatile solutes:
i) effect on vapour pressure: When a non-volatile solute is dissolved in a volatile solvent, the concentration of volatile solvent particles at the surface of the liquid is decreased (FIG. A3.2.). This reduces the rate at which solvent particles leave the surface of the liquid, and this is recorded as a lowering in vapour pressure.
Note that in entropy
terms (chapter 12) a non-volatile solute introduced into a solvent will
increase the disorder in the solvent. Thus there is a smaller increase
in entropy on formation of the vapour.
In ideal solutions, the relative
lowering of vapour pressure is found to be proportional to the mole
fraction (section 8.3.4.) of the solute particles. This is a
traditional statement of Raoult's law (see also section A3.3.2.).
However, it is easier to realise that the lowered
vapour pressure is (not surprisingly) found to be proportional to the
mole fraction of the solvent:
i.e. .....................................pL = ps x X1
Where: pL
= the lowered vapour pressure, ps = the vapour
pressure of pure solvent, and X1 = the mole
fraction of solvent.
Where, N = the number of moles of solvent particles, and n = the number of moles of solute particles. Note that the number of solute particles will depend on the degree of dissociation.
Since numbers of moles
can be calculated from masses and molar masses, the lowering of vapour
pressure can be used to work out molar masses and hence relative
molecualr masses (FIG. 1.1.). Note, that deviations occur for non-ideal
solutions; dilute solutions are therefore preferable. Also,
calculations are easier for dilute solutions because N + n  1.
1.
ii) Effect on boiling point: It will be realised from the effect of non-volatile solutes on vapour pressure, that solutions of non-volatile solutes will require a higher temperature before vapour pressure equals atmospheric pressure. Thus non-volatile solutes elevate boiling point.
In dilute solutions, the elevation of boilng point is, not surprisingly, found to be proportional to the mole fraction of solute particles:
......................................... T = KbX2
Where: T = the elevation in boiling
point, Kb = the boiling point (or ebullioscopic)
constant, and X2 = the mole fraction of solute
particles.
Again, elevation of boiling point can be used to determine relative molecular masses. Again, degree of dissociation must be taken into account when relevant.
iii) Effect on freezing point: Non-volatile solute particles lower the freezing point of a solvent by distorting the solid lattice and reducing the forces of attraction within it. The temperature of the liquid must be reduced to a greater extent before the attractive forces in the disrupted lattice can overcome the motion of the particles.
As with lowering of vapour pressure, entropy considerations enable prediction of the same outcome, because the solution is more disordered than the pure solvent and the entropy change on freezing is therefore greater. Although the lattice containing solute particles is distorted, once formed it is (relatively) little more disordered than the pure solid, especially for dilute solutions.
In dilute solutions,
the depression in freezing point (T)
is again found to be proportional to the mole fraction of solute
particles:
.........................................T = KfX2
Where: Kf is the freezing point (cryoscopic) constant.
Once more, depression of freezing point can be used experimentally to determine relative molecular masses, but once more, dissociation must be taken into account when it occurs.
iv) Osmosis: The above properties are called colligative properties. Colligative properties are those which depend on the number (concentration) of solute particles in solution and are independent of the type of solute particle.
Thus, the relative lowering of vapour pressure, the elevation of boiling point, the depression of freezing point, the boiling point constant, and the freezing point constant, are all a function of the molality of the solution with respect to solute particles and depend on the nature of the sovent, but they do not depend on the type of solute particle. (Molality is concentration measured in terms of mole fraction {as if molarity isn't enough}.)
Another colligative property is osmosis. Osmosis is the tendency of solvent molecules to pass through a semi-permeable membrane from dilute solutions (low solute concentration, high solvent concentration) to concentrated solutions (high solute concentration, low solvent concentration).
A semi-permeable membrane allows the passage of solvent molecules but not solute particles. Examples of semi-permeable membranes include: cellulose ethanoate, cell membranes, and the skin inside the shell of an egg.
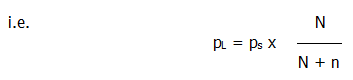
Osmosis may be
prevented by applying pressure to the more concentrated solution. The
pressure required to prevent osmosis from pure solvent into a solution
is known as the osmotic pressure of the solution.
It can be measured using apparatus such as that shown in FIG A3.3., and
solutions with the same osmotic pressures as each other are said to be isotonic.
Not only is the osmotic pressure
of a solution found to be proportional to the concentration of solute
particles it contains, it is also found to be proportional to the
temperature. In fact, the relationship between osmotic pressure ( ), concentration of solute
measured as n moles per volume V, and temperature T, bears a remarkable
resemblance to the ideal gas equation (section 5.4.4.iv.):
), concentration of solute
measured as n moles per volume V, and temperature T, bears a remarkable
resemblance to the ideal gas equation (section 5.4.4.iv.):
........................................... = n/VRT
i.e..................................... V = nRT.
Where R is the universal gas constant. (The main [second] equation is known as the van't Hoff equation.)
Osmosis is particularly useful in the determination of relative molecular masses. Very dilute solutions can be used, as illustrated by the fact that an aqueous solution which is 0.1 molar with respect to solute particles would exert an osmotic pressure high enough to support a column of water 26m high, whereas the effects on boiling and freezing point would hardly be detectable.
This, combined with the fact that osmosis measurements can be performed at room temperature, makes the technique especially useful for biological molecules and macromolecules. Osmosis is also used to concentrate solutions of biological molecules. A solution of the molecules contained in a semi-permeable bag is placed in a more concentrated salt solution.
v) Phase
diagrams: Phase diagrams can be drawn for liquid/solid
systems. These are again plots of experimental results. For example, in
diagram A3.4., the line EZ is a plot of the results from a series of
experiments in which the temperature is noted at which a solid (B)
precipitates out of various solutions (in A).
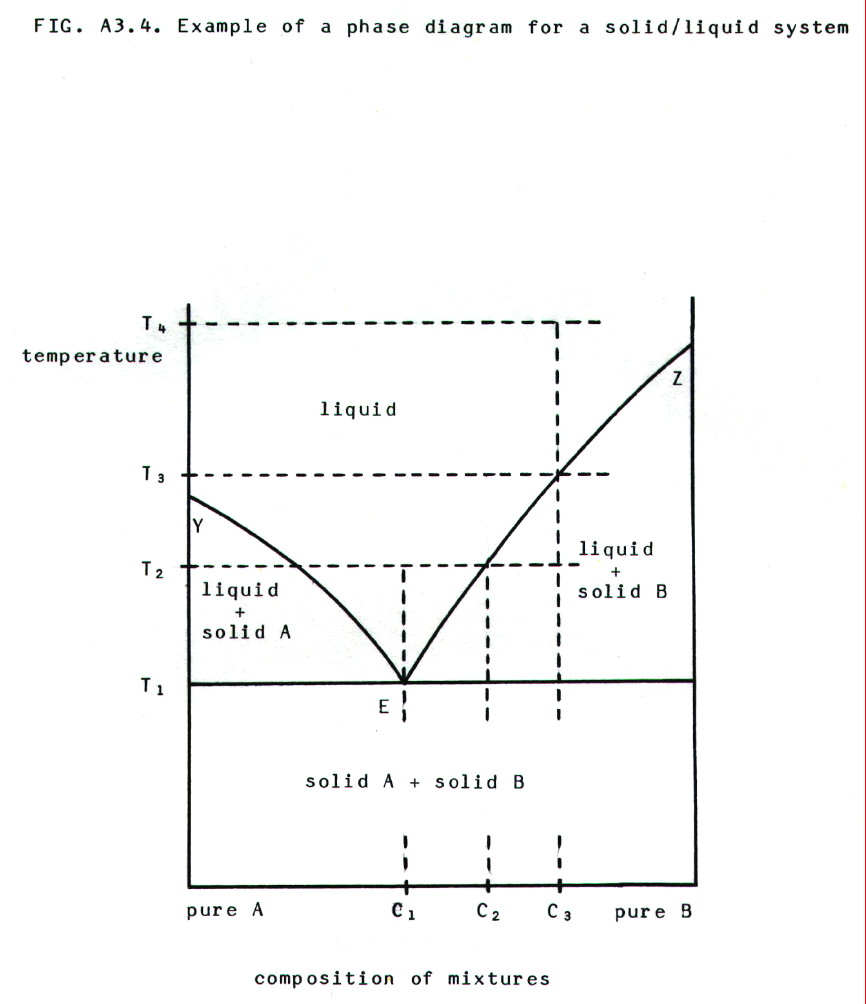
In the diagram: Y  melting temperature of pure A, Z melting
temperature of pure B.
melting temperature of pure A, Z melting
temperature of pure B.
At T4 a mixture of composition C3 is entirely liquid (so is any other mixture of A and B). If it is cooled to T3 pure solid B begins to precipitate, leaving the liquid richer in B. It follows that EZ is the solubility curve for B in A.
Cooling the mixture to T2 will cause more precipitation and produce a mixture containing solid A and a liquid of composition C2. When the temperature is reduced further to T1, the remaining liquid (which is even richer in B and which has composition C1) freezes.
The mixture of composition C1 is called a eutectic mixture. If a liquid with that composition is cooled (e.g. from T2), the entire mixture will solidify at T1, but at no stage before that will either pure A or pure B be precipitated. The eutectic mixture of lead and tin melts at 183°C and is used as electrical solder. (At least, solder as it used to be when it worked and before the Health and Safety brigade decided solder that works is dangerous, so now we all have to use solder that doesn't work.)
A3.3.2. Solutions of liquids in liquids: Raoult's law applied to miscible ideal liquids states that the partial pressure of a component in the mixture is equal to the vapour pressure of the pure component multiplied by its mole fraction in the mixture (c.f. section A3.3.1.i.). Moreover, the total pressure will be the sum of the partial pressures.
Mixtures of
methylbenzene and benzene show almost ideal behaviour, as represented
by FIG. A3.5.
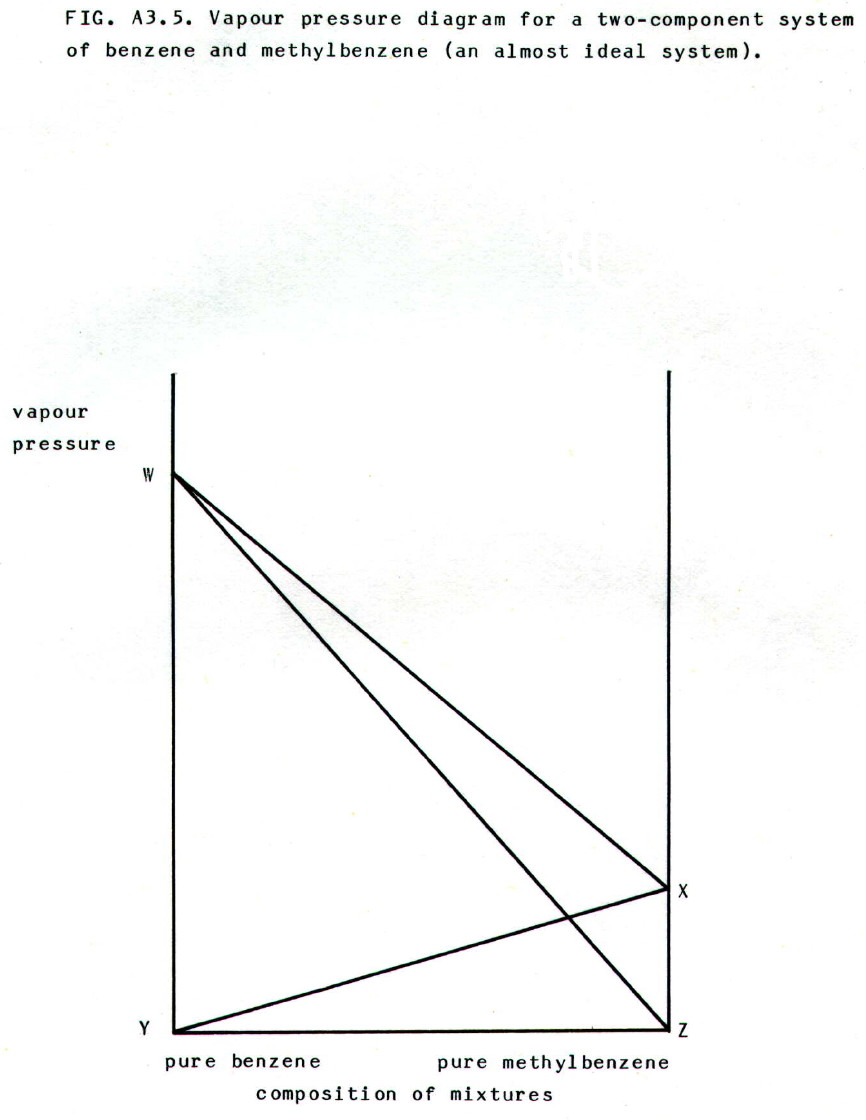
In the diagram:
• YX represents the linear increase in the partial pressure of methylybenzene as its mole fraction in the mixture increases.
• X represents the vapour pressure of pure methylbenzene.
• ZW represents the linear increase in partial pressure of benzene as its mole fraction in the mixture increases.
• W represents the vapour pressure of pure benzene.
• WX shows the linear change in total vapour pressure (sum of the partial pressures) as composition of the mixture changes.
In general, for ideal mixtures of A and B:
........................................ pA = XAp°A
........................................ pB = XBp°B
and.................................... p = pA + pB
where: pA and pB = the partial pressures in the mixture of A and B
XA and XB = the mole fractions in the mixture of A and B
p°A and p°B = the vapour pressures of pure A and B
p = the total vapour pressure of the mixture
A3.3.3. Distillation
of liquid/liquid mixtures. To describe the events during
distilllation, boiling point curves are more useful than vapour
pressure curves. FIG. A3.6. shows vapour pressure and boiling point
diagrams for near ideal liquid mixtures of A and B.
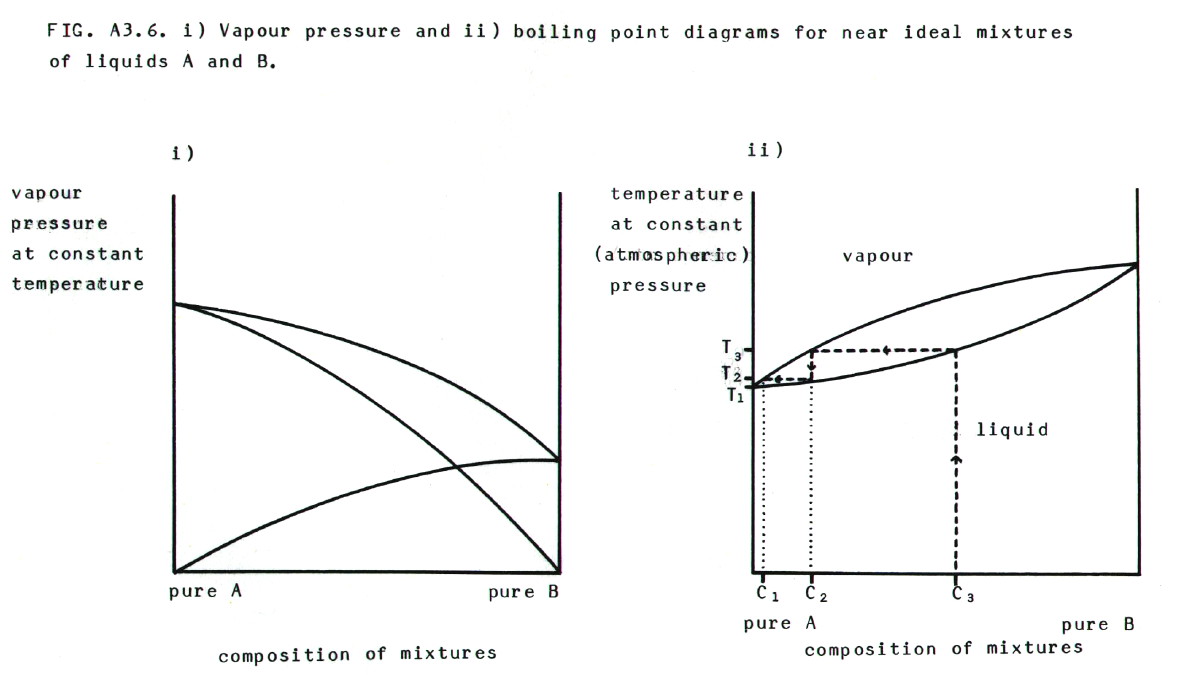
If the liquid with composition C3
in diagram ii) is heated to temperature T3, it
boils and produces a vapour with composition C2.
Note that the vapour is richer in A, the more volatile component. If
this is carried out in distillation equipment such as that described in
section 23.2.3., the vapour condenses higher up the fractionating
column when it reaches T2 or lower. The
condensed liquid, with composition C2, then
drips back to hotter regions of the column, where it boils again to
produce a vapour which is even richer in A; it has the composition C1.
This process continues until pure A is collected via the side arm of
the fractionating column. At the outlet to the side arm, the
temperature should be equal to the boiling temperature of pure A, i.e.
= T1.
A3.3.4. Non-ideal behaviour in liquid/liquid systems:
i) Ideal behaviour is most likely to be observed when the two molecules in the system are similar. It is in such cases that the attractive forces between particles in the mixture are most likely to be similar to the attractive forces in either pure liquid. In non-ideal solutions, interactions between the unlike particles change the attractive forces.
ii) Positive deviations from ideal behaviour (like going punting when you should be revising) and Raoult's law occur when attractive forces between unlike particles in the mixture are less than they are between the like particles. This is recorded as a higher vapour pressure than expected, and a consequent lower boiling point. E.g. water/ethanol, water/pyridine, and propanone/carbon disulphide.
iii) A negative deviation is one (in which people get hurt) in which the vapour pressure of a mixture is lower than that predicted for an ideal solution, and the boiling point is consequently higher. It occurs when attractive forces between unlike particles in the mixture are greater than they are between like particles. E.g. trichloromethane/propanone, and nitric(V) acid/water.
iv) Azeotropic mixtures. FIG. A3.7. shows boiling temperature curves for systems showing both positive and negative deviations. Examples of distillation are shown in each case by dotted lines.
Note that in the case
of the positive deviation the mixture with composition a1
is known as a minimum boiling point azeotropic mixture
(by whom you may well ask). In the case of the negative deviation, the
mixture with composition a2 is known as a maximum
boiling point azeotropic mixture (study question 5).
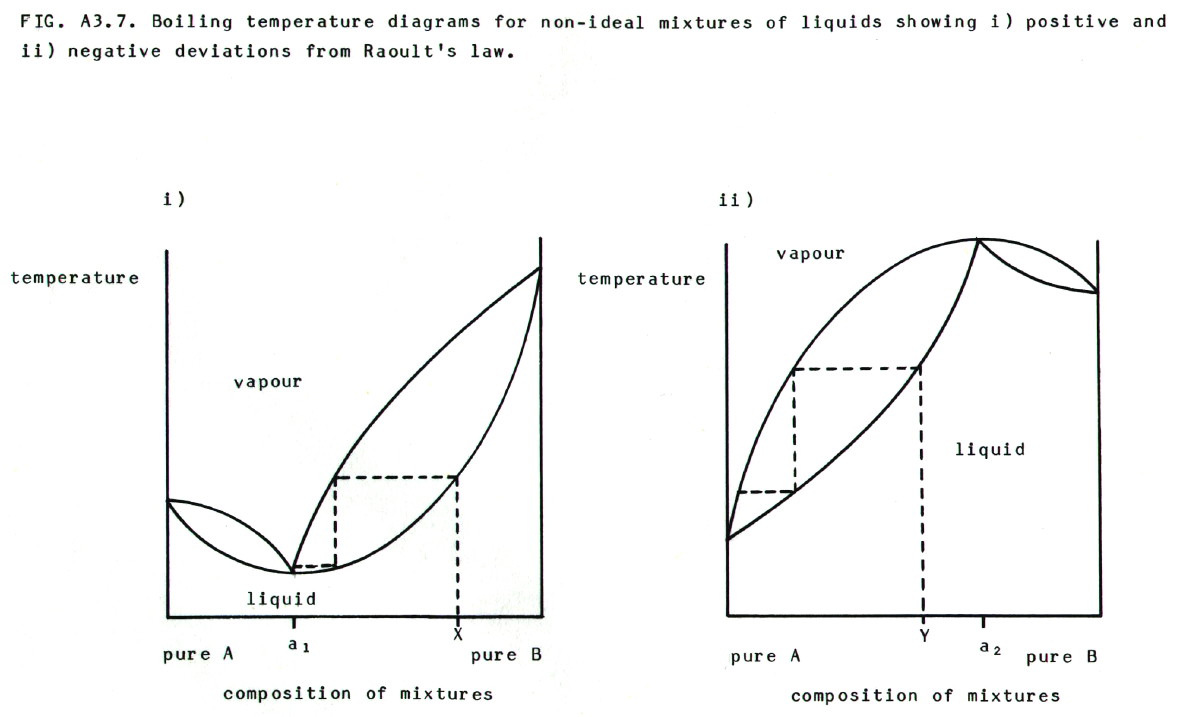
Note also that distillation of
X, as shown in diagram i), would eventually produce a distillate of the
minimum boiling point azeotrope, leaving pure B in the flask.
Distillation of Y, as shown in diagram ii), would eventually produce a
distillate of pure A, leaving the maximum boiling point azeotrope in
the flask.
A3.3.5. Solubility of gases in liquids: The solubility of an ideal gas in a solvent is found to be directly proportional to the pressure of the gas at a given temperature, provided the gas does not react with the solvent. (This is an expression of Henry's law).
Also, gas solubility usually decreases with increasing temperature.
A3.4. THREE COMPONENT SYSTEMS
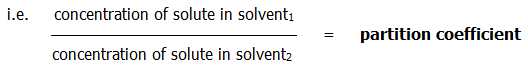
A3.4.1. Distribution or partition law: When a solute is shaken with two immiscible solvents until equilibrium is reached, it is found that the ratio of its concentrations in the two solvents is a constant for a given temperature, provided that the solute exists in the same state in both solvents:
Suitable immiscible solvents are any of the following in combination with water: ethers, trichloromethane, tetrachloromethane, and benzene. They are, of course, all sparingly soluble in water.
Partition is relevant to solvent extraction (section 23.2.5.) and chromatography (section 23.2.7.). Well, that is, if you think it's relevant at all.
So, you made it to the end of the chapter and you're still alive. Please email me to let me know how much you read and how you managed to survive. I found a couple of beers helped me - and that was when I was uploading it, not when I wrote it. I can't remember how I survived writing it. Maybe you've read the whole book. If so, please email me to tell me which bits you found most helpful and what I can do to make it (even?) better for you!!
Anyway, I hope there's been something here that's helped you to get 'Chemistry in Perspective'.
If it's any help, while I was writing this book, I was also writing the pop pages for a UK newspaper, interviewing two local and two national/international bands every week. The chemistry was more interesting - except, perhaps, for phase equilibria.
A3.5. QUESTIONS
1) Re-write section A3.2.4. in terms of energy.
2) A much-used text book contains the following statement: "Some solids, for example iodine, turn to vapour without an intermediate liquid state because the vapour pressure of the liquid form is greater than atmospheric pressure". Comment.
3) Another well-established text book contains the statement: "The total vapour pressure of a mixture of two liquids is the sum of their partial pressures...(This is a consequence of Dalton's Law.)" Comment.
4) For diagram i) in FIG. A3.7. describe what would happen if you distilled a mixture with a composition to the left of a1. Similarly, for diagram ii) in the same figure, describe what would happen if you distilled a mixture with a composition to the right of a2.
5) "Azeotrope" comes from the Greek meaning "boiling without change". Explain why this name has been adopted for mixtures such as a1 and a2 in FIG. A3.7.
6) Remembering that the partition law applies only to solute particles which are in the same state in both solvents, describe how you could use a partition experiment to determine the equilibrium constant for the reaction:
I2(aq) + I-(aq) ⇌ I3-(aq)
Unless otherwise stated, all materials in this web version of appendix iii are © 2007 Adrian Faiers MA (Oxon) MCIPR

What 's the connection between a dozen eggs and
a garden mole?

Answer: Not a lot, really, but see Chapter 1